The first step in analyzing the performance of QTP Gas Emporium is to enter the data.
Enter the Arrival rate, Number of servers and Queue Capacity into a blank spreadsheet as shown above. We have used bold font to identify numbers that were enter directly, to distinguish them from numbers that are calculated with formulas. We have also included labels (such as "Arrival Rate") in the spreadsheet as reminders of what each number represents. The remainder of the tutorial will give you explicit instructions on what formulas and numbers to enter where, but it is up to you whether you also format numbers in bold face and enter explanatory labels on your spreadsheet.
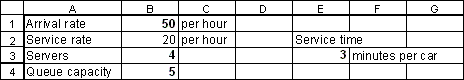
The information above did not provide a service rate directly. Instead, we were told that the average time that a customer (a car) ties up a server (a pump) is 3 minutes. This is the service time per customer, not the service rate (a rate is a quantity per unit time). Enter the service time in cell E3 as shown.
To convert the service time to a service rate, enter the formula "=60/E3" in cell B2. The result is a service rate of 20 cars per hour. This means that on average, each of the 4 pumps could serve 20 cars per hour if the pump was never idle. Note that the formula you entered performed two conversions:
From a service time to a service rate (by taking the inverse of the quantity in cell E3)
From minutes to hours (by multiplying with 60).
A common error in analyzing waiting lines is to use inconsistent time units, which typically leads to nonsensical analysis. To avoid this, it is good practice to explicitly state the time units of the arrival and service rates you are using, as shown in the spreadsheet above.